Pricing Intelligence for B2B Manufacturers and Distributors
We recover the margin that reactive pricing costs you.
See today which products and customers will cost you margin tomorrow — and give your sales team arguments instead of gut feeling. For B2B companies with their own product portfolio.
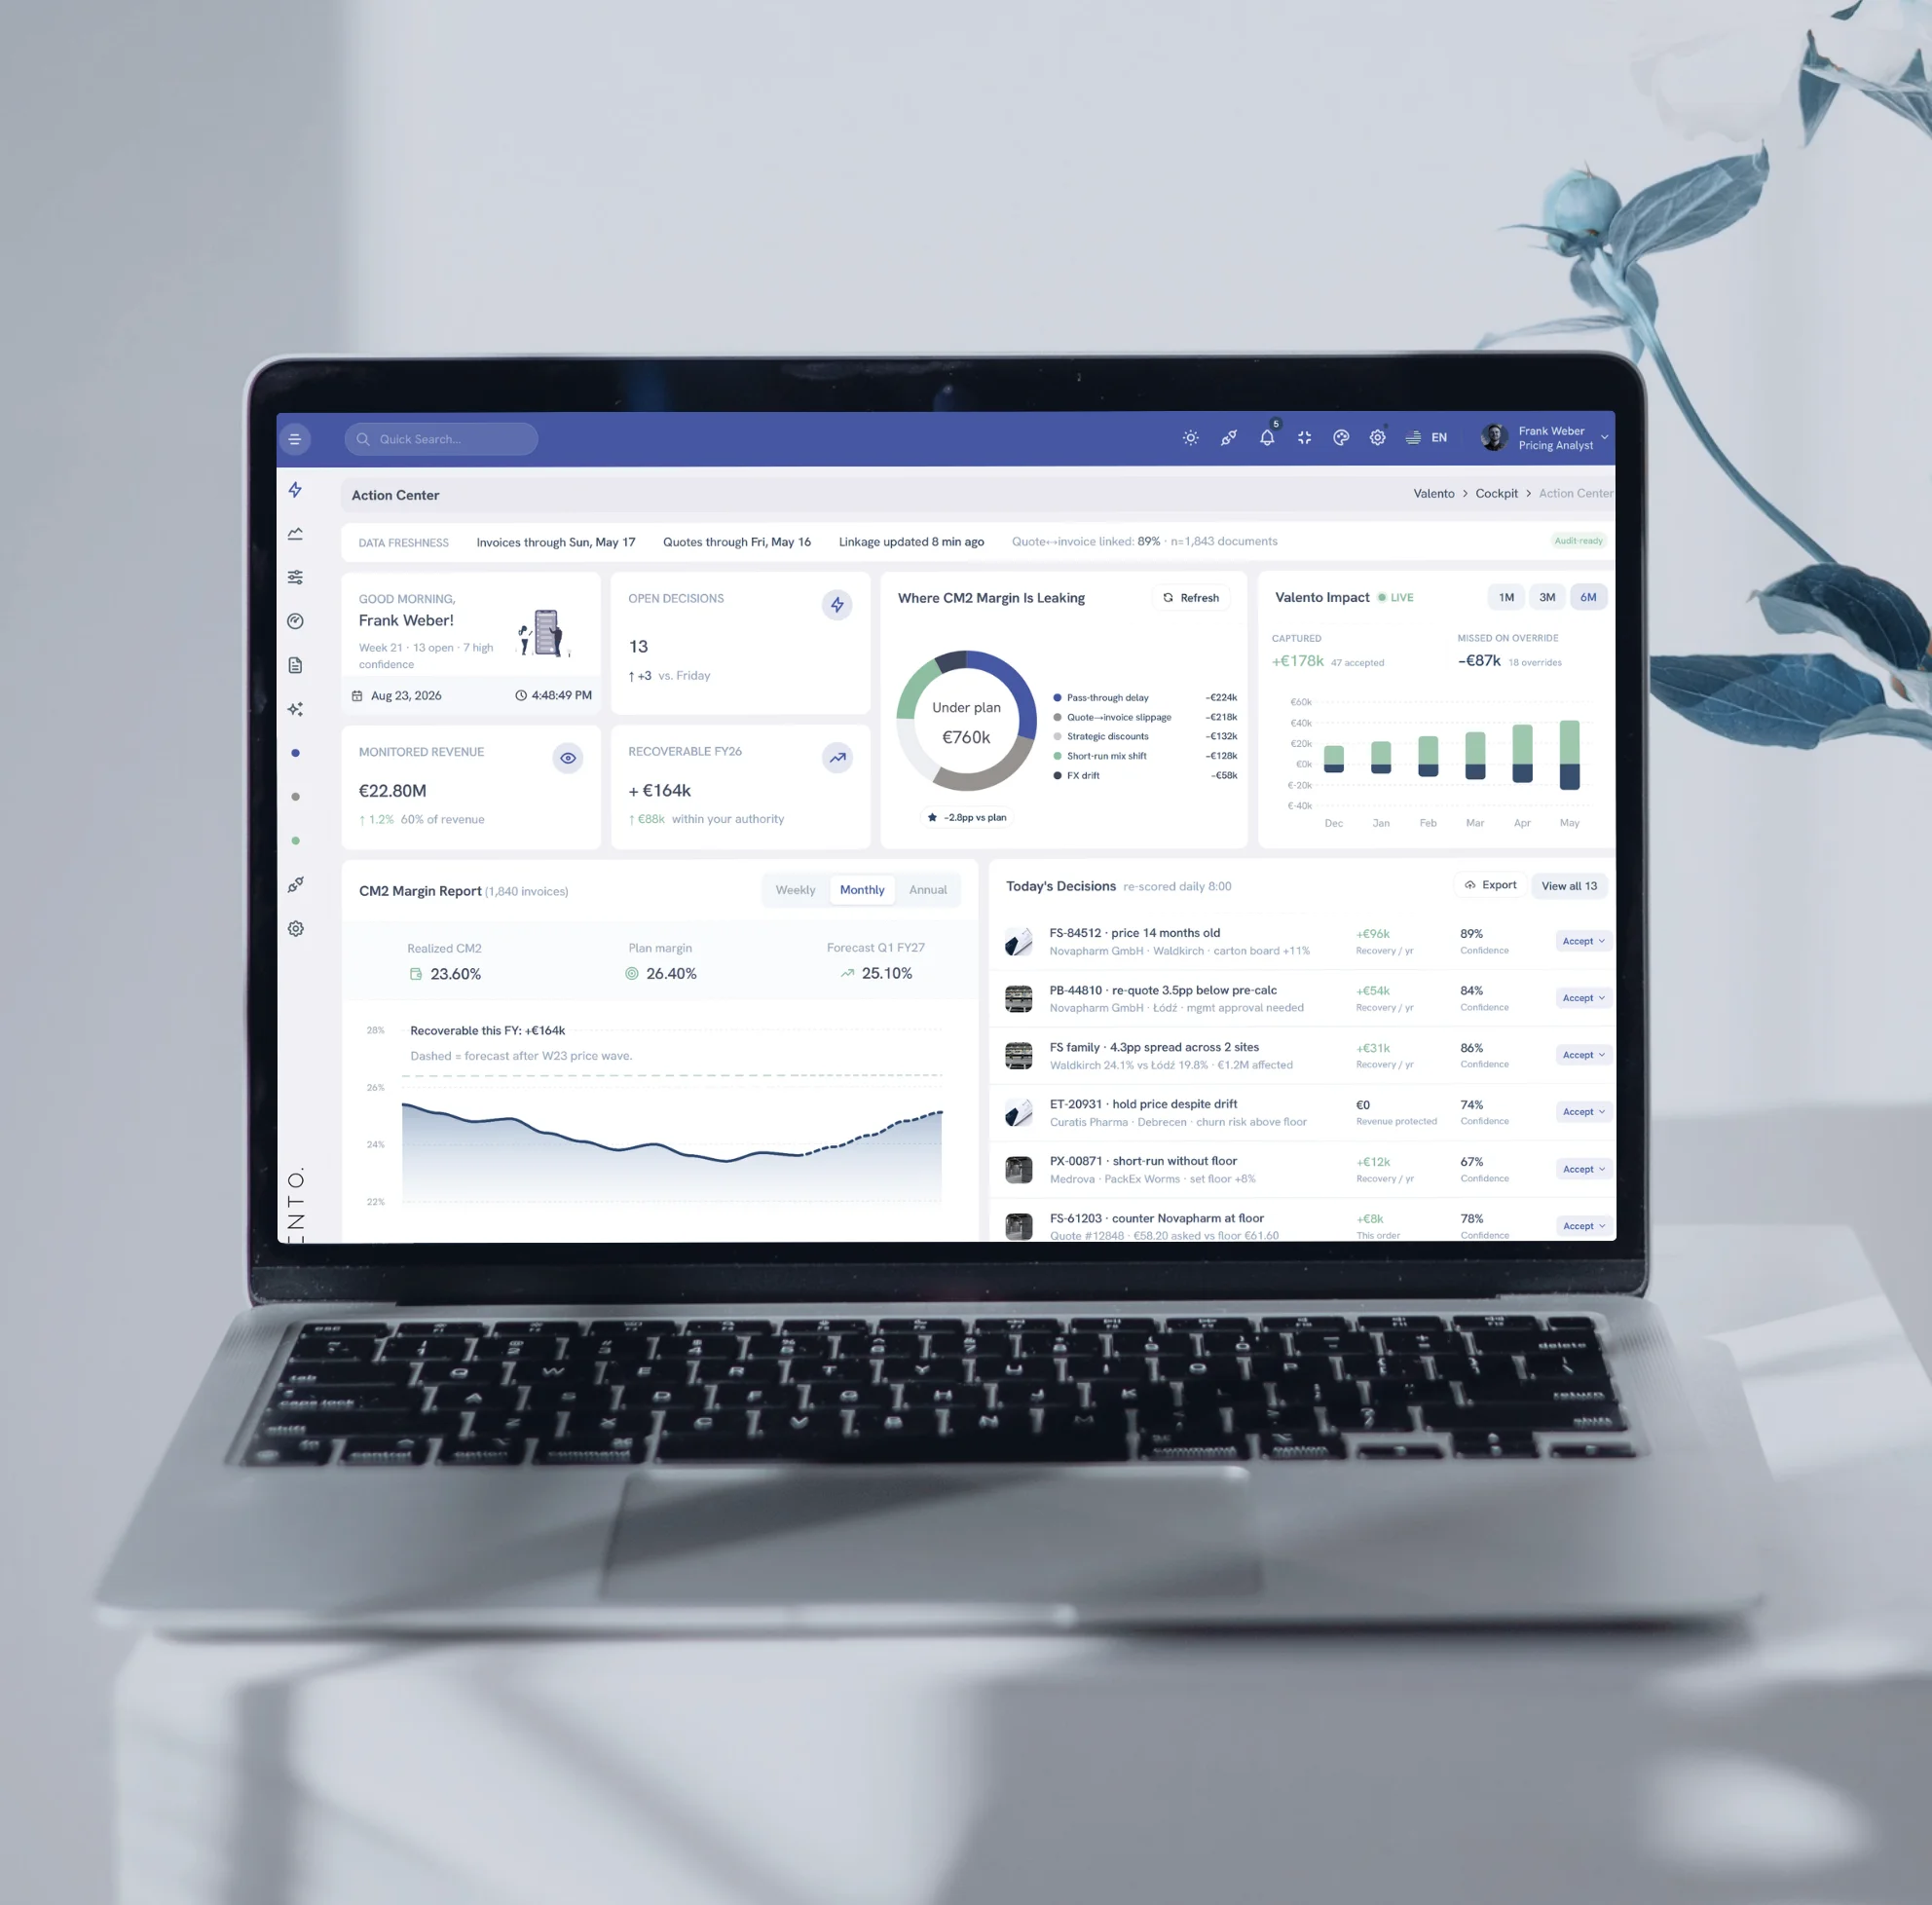
The product in 70 seconds|Ask your margins a question — and get the answer with the evidence behind it.
Demo view. All company names, people and figures are fictitious; any resemblance to actual companies is unintended.
References & partners








Analysed to date
€180m
revenue analysed
51,000
documents and line items
2,700+
articles across 2,200+ customers
Total across analyses to date, anonymised. Scope of the data analysed — not a statement of results.
The hidden problem
Every lost order follows a pattern.
Pricing losses follow patterns buried in your data — in quote histories, in customer terms, in the gap between the price you calculated and the price you invoiced.
Your ERP shows you where you've been. Your reporting shows you what happened. Neither shows you where your margin is heading right now.
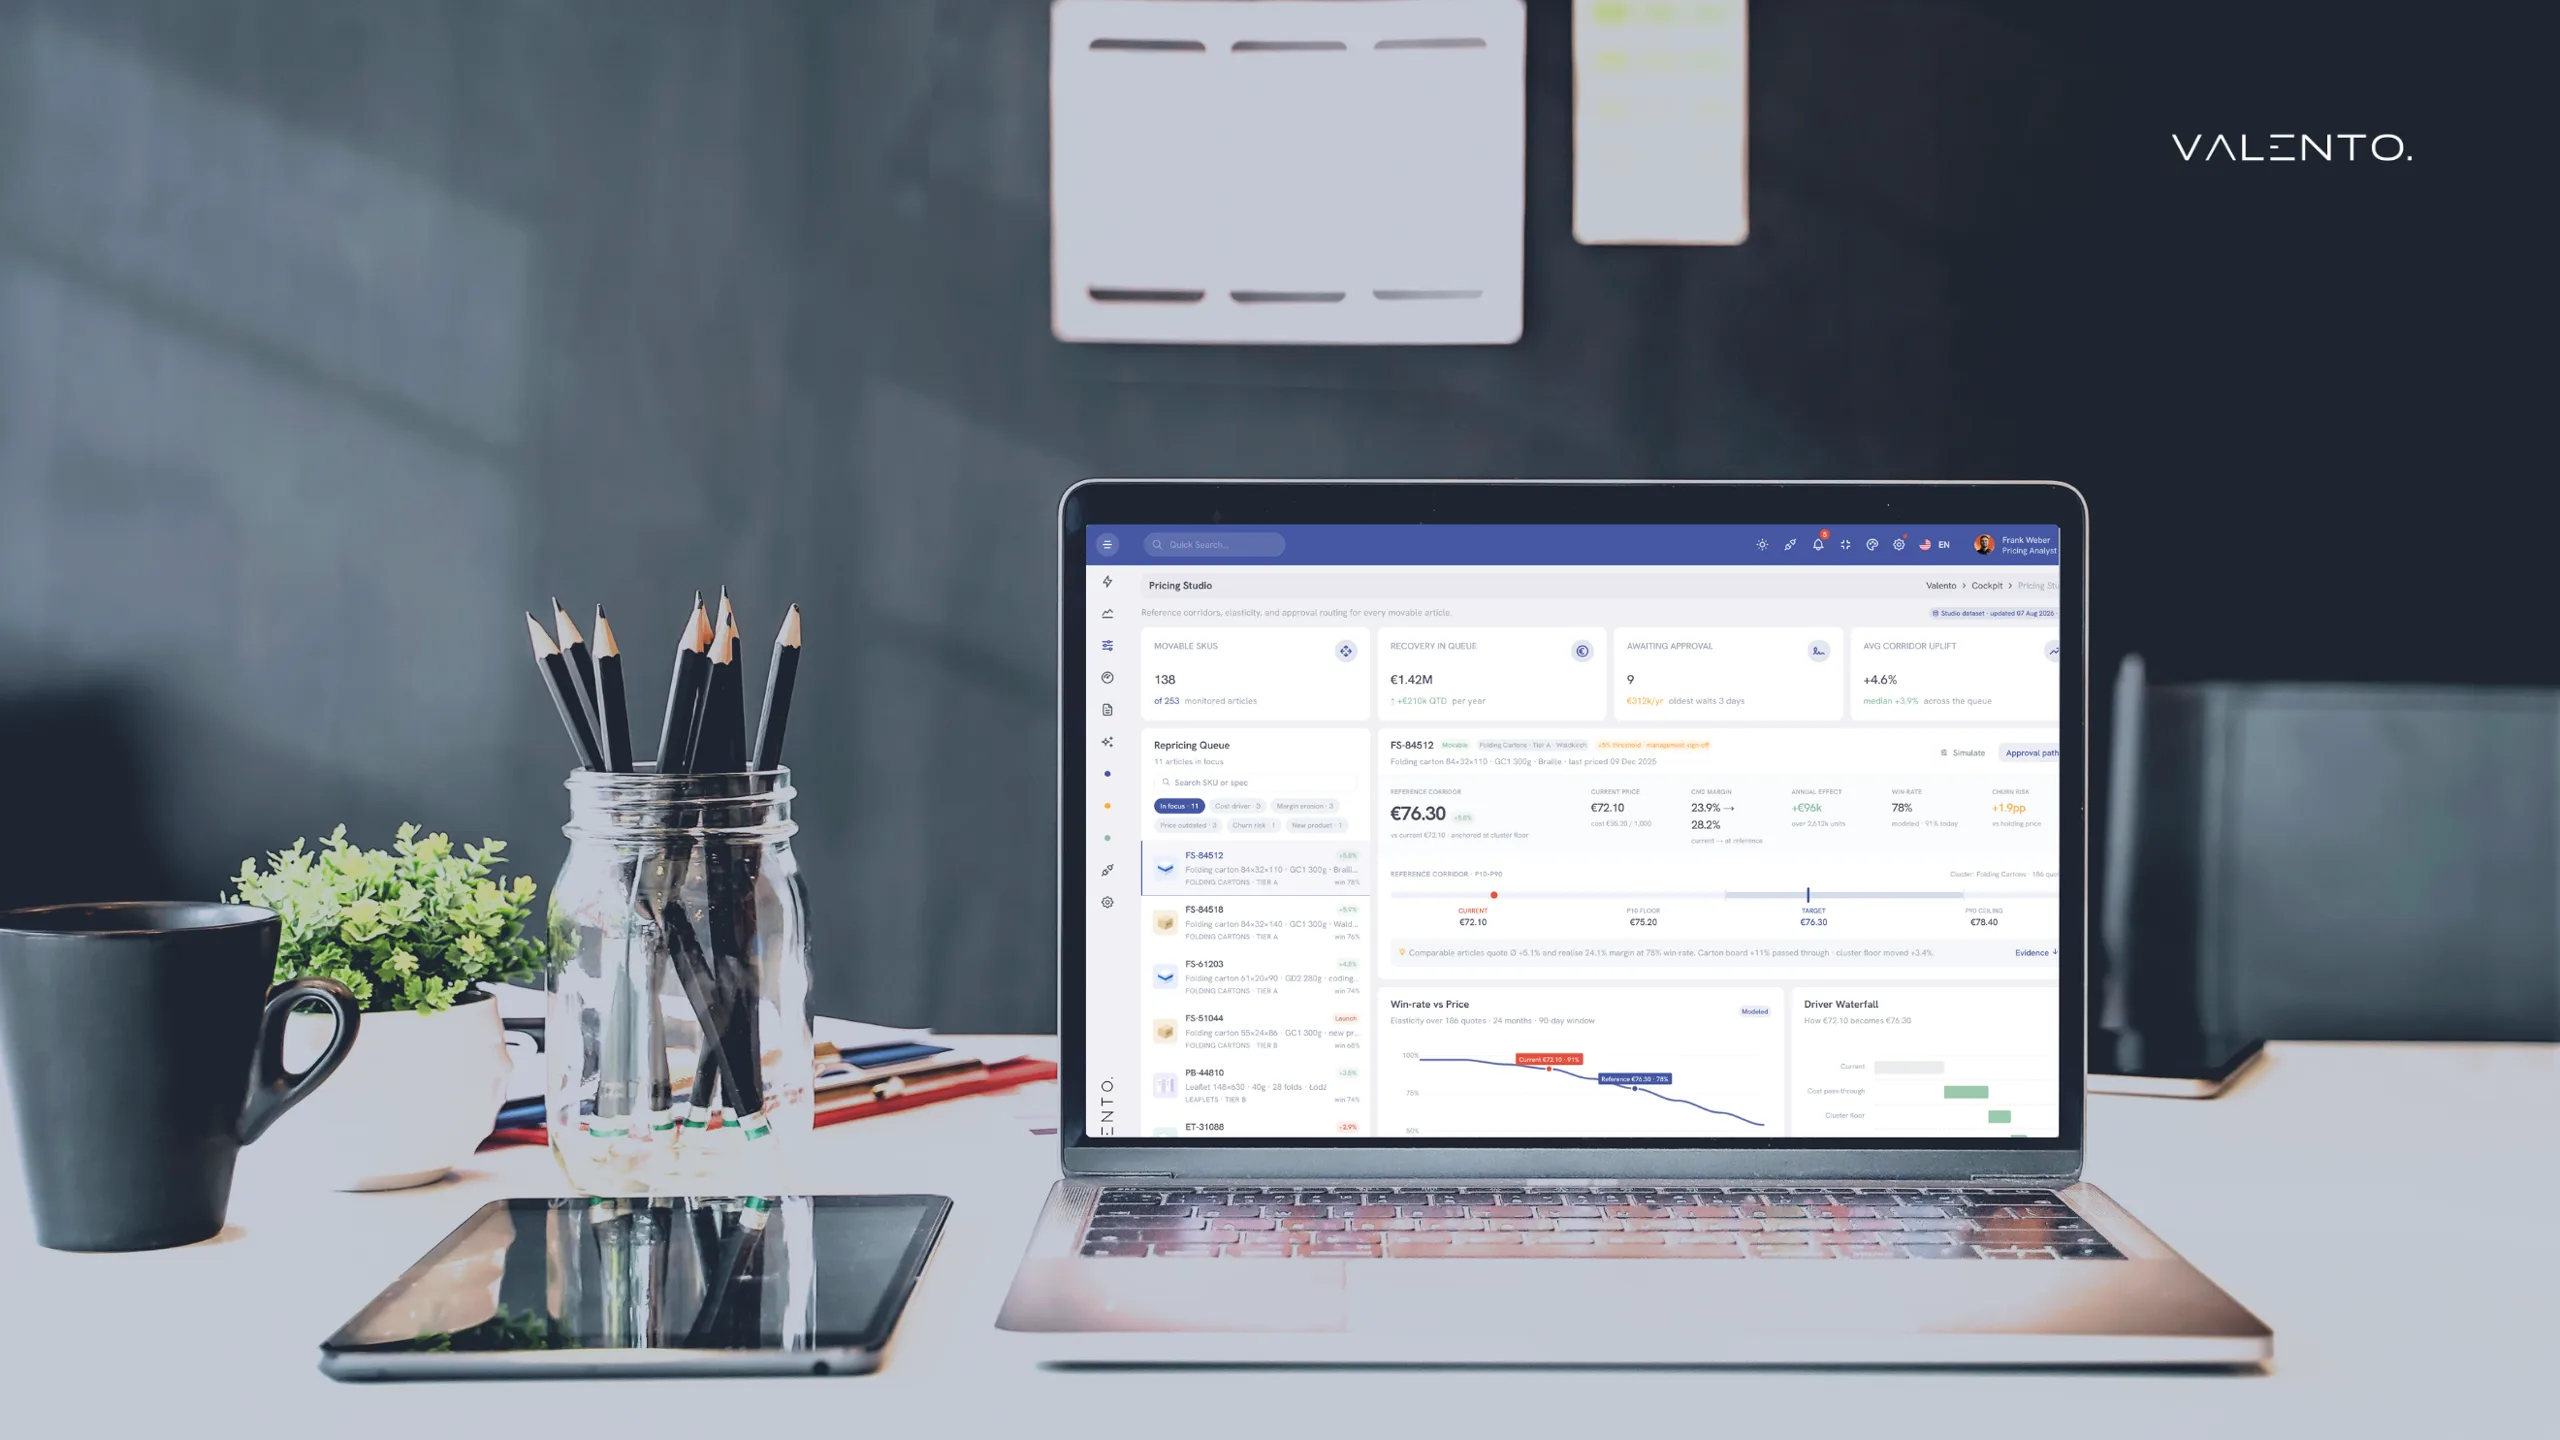
Three steps, full control
How it works.
01
Demo · 30 min
We show you what typically lives in data like yours. No commitment, no preparation required.
02
Margin Scan
Two short meetings, one pseudonymised data export — no IT project. At the end: a decision basis in euros and your first actionable levers.
03
Platform
Ongoing pricing recommendations, early warning, deal empowerment. You decide the scope.
Each phase ends with a Go/No-Go. You decide how far you go.
What it costs
The Margin Scan costs €950 net — a fixed price. If it finds no deviations worth at least €10,000 a year — measured against your own target margin — you do not pay for it. If you go on from there, it is credited in full.
How you pay
For the platform stage you choose: a predictable fixed price — or a lower fixed share plus a bonus if the effect materialises. Some want budget certainty, some want us to carry part of the risk. Both are available.
After the scan
“The analysis of article margin against revenue shows at a glance which products are stars, which are niche — and where we need to reprice. We had roughly half of the findings on our radar. The other half we genuinely did not.”
Business unit lead, B2B manufacturer
Case Studies · anonymised
What we find in real data.
nearly doubled
Share of lines below the margin floor — within three years
The average margin of the same product group looked stable over the same period. That is precisely the point: the mean reassures while the tail spreads. And the gap is not spread across the whole portfolio — it sits in a manageable number of customer-article combinations. This is not a case for a broad price increase but for a check at quote time, before the order goes out.
4,000+
Orders below minimum margin — no guardrail in daily work
Over several years, more than 4,000 order positions sat below the internal minimum margin. Margin guardrails make it visible — before a quote goes out — where a position breaches the defined threshold, and give sales the rationale to hold a price.
1 : 13
Same article, 13× price spread
A single high-volume article in one portfolio sold at a 1-to-13 price ratio between the lowest and highest sale — same article, same period, different customers. Such spreads rarely result from deliberate price policy — they usually trace back to missing guardrails in the quotation process or individual data outliers. Without SKU-level dispersion analysis, they stay invisible in reporting.
€60K
Gap between calculated and invoiced margin
A systematic deviation between quote and invoice — stable over years, invisible in any report. With larger portfolios, this scales quickly into seven figures.
76
Margin-loss products — separated for the first time
Which are deliberately priced strategically (market entry, key account, cross-sell) — and which are eroding unnoticed? Before Valento, both groups ran without distinction.
Anonymised insights from completed Margin Scans — every figure from real invoice data, no benchmarks.
Your effort
One file. That is all we need.
You export from your system whatever comes out of it anyway — in the format of your choice. You upload the file yourself. That is your part done.
Your side
One file
Exported from your system. You upload it yourself.
Our side
Analysis
One week later the result is there.
No access to your systems, no interface, no IT ticket. Only if you later want continuous reading do we connect your systems directly — Business Central, Dynamics 365, Salesforce, HubSpot, SAP or your database. Read-only then as well, and only the fields you release.
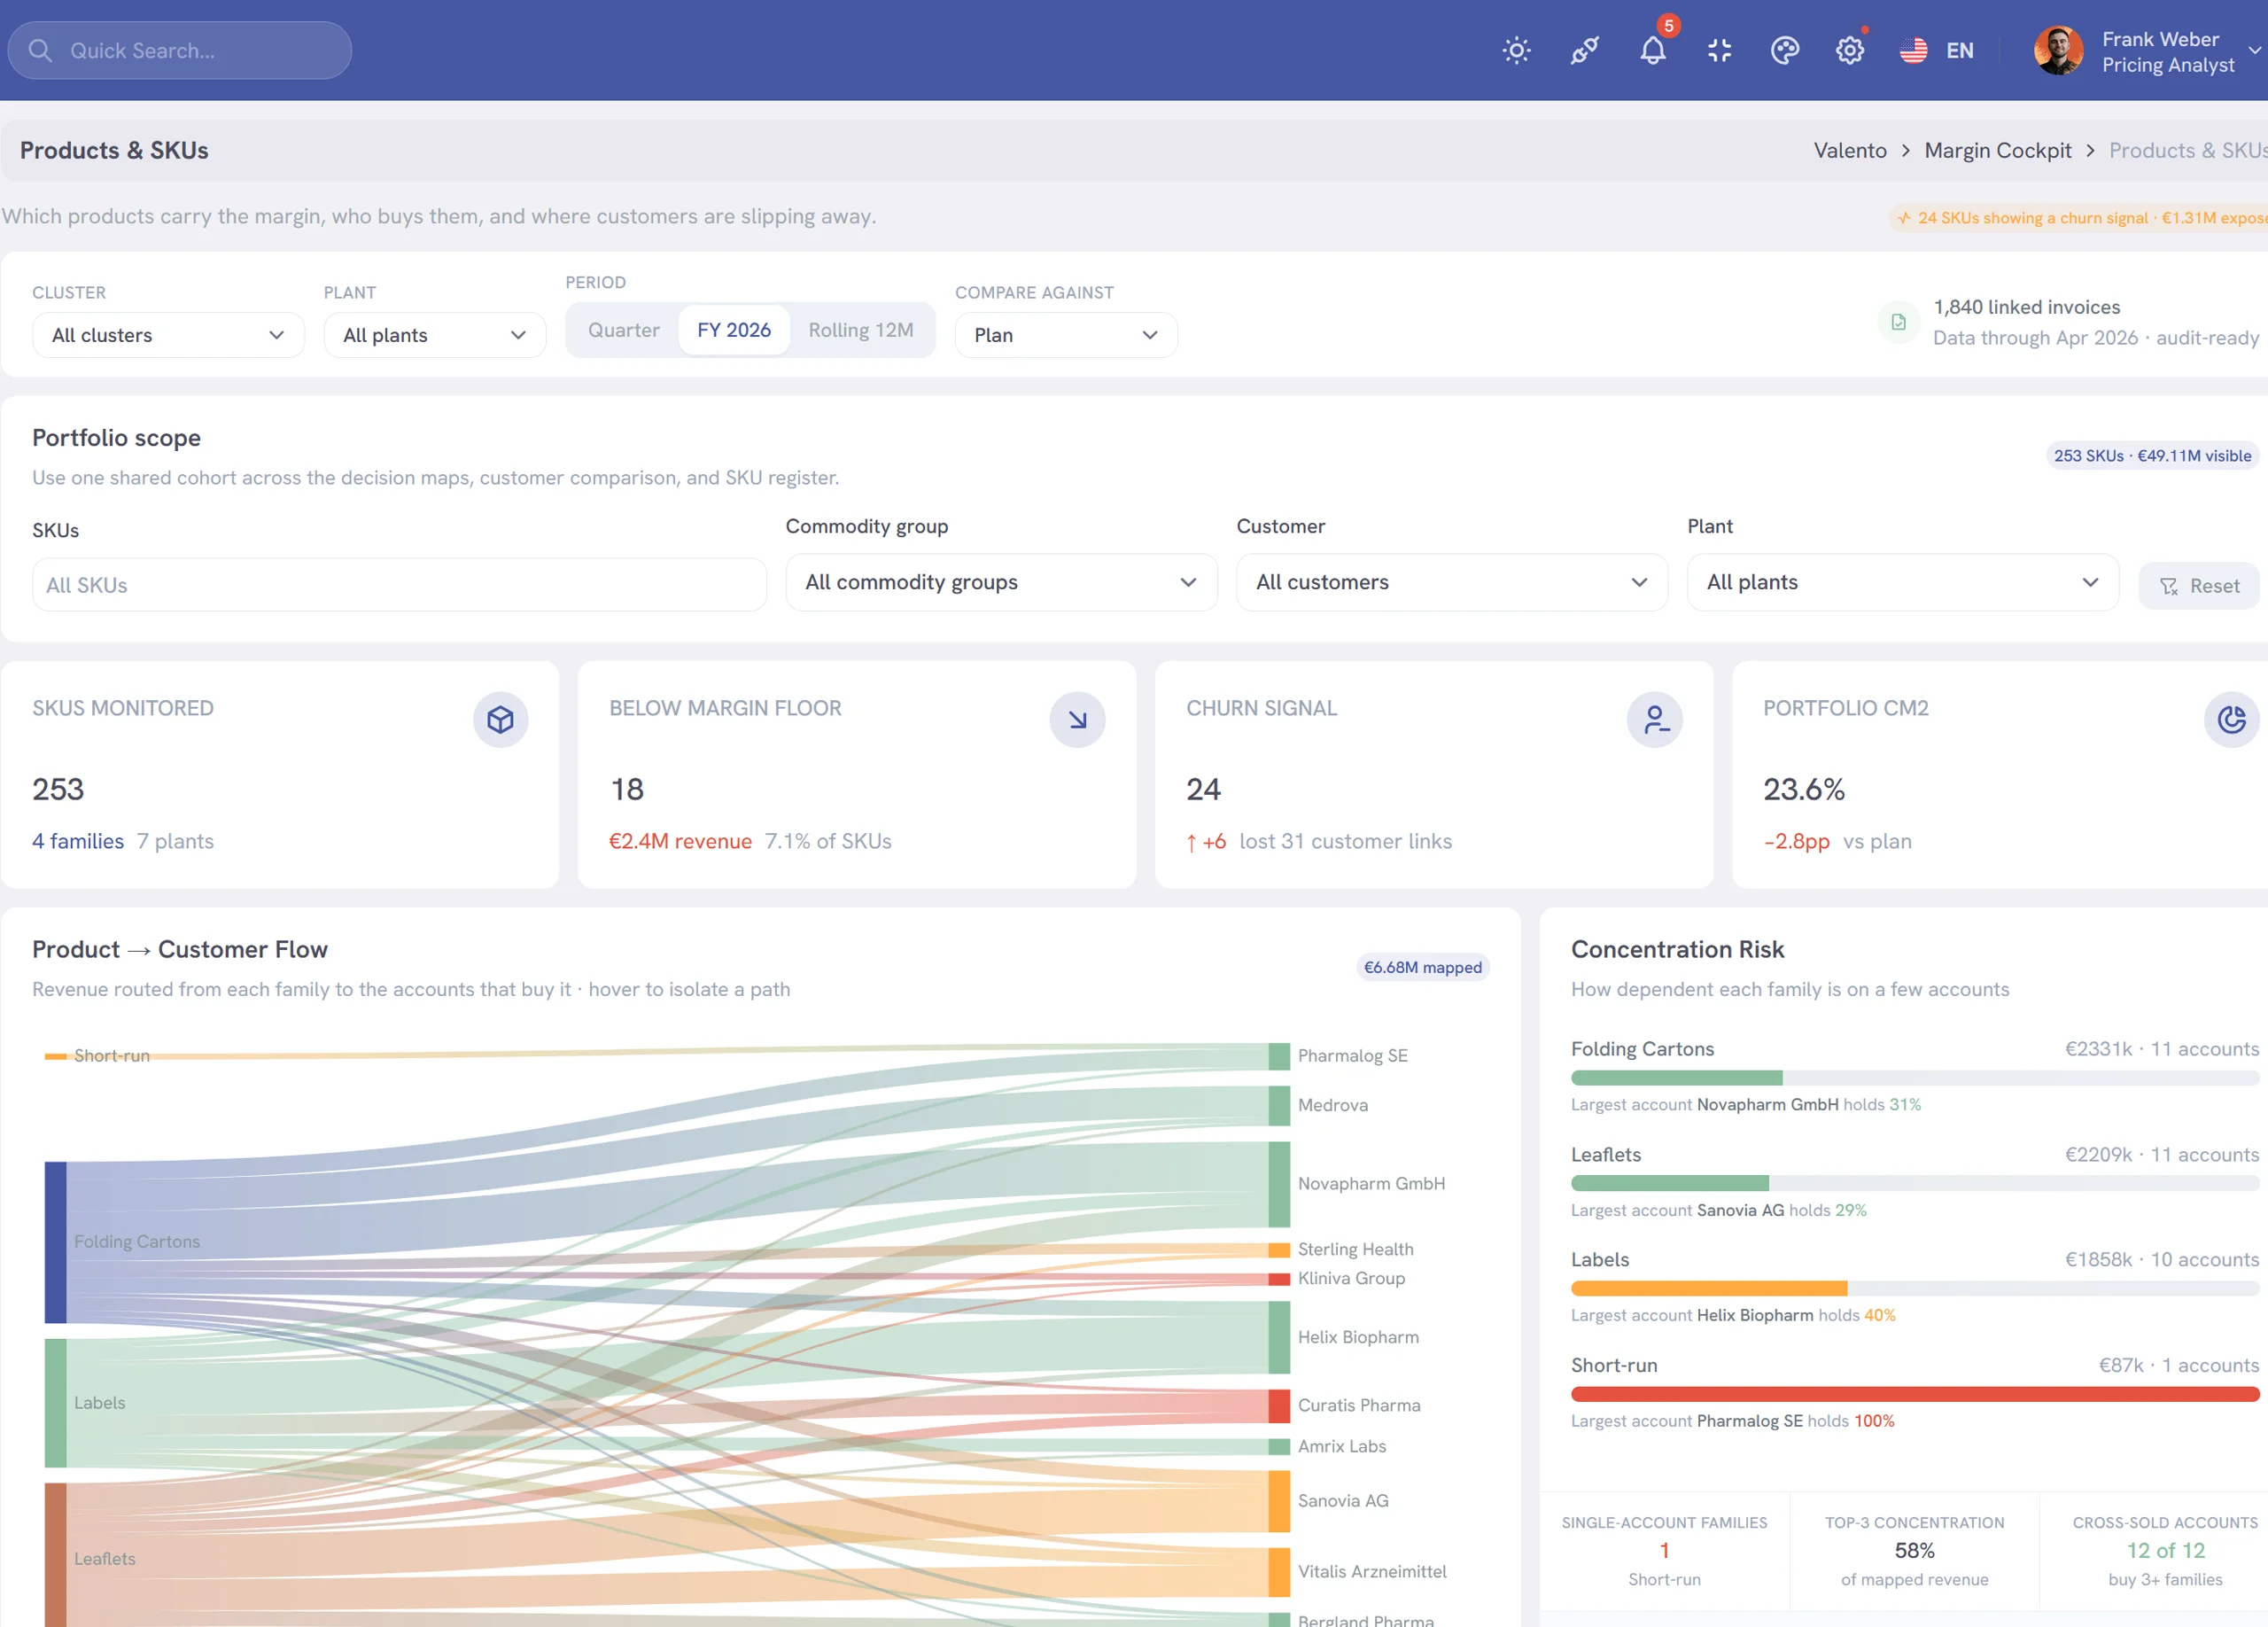
No write access. Nothing opened into your network from outside. EU-hosted, revocable at any time.
After the results meeting you get your own access — with your numbers in it, not a demo with someone else's. Four weeks, to work through the findings and show them to your team without us in the room.
Three roles, one platform
Who Valento is built for.
Leadership
Control before it escalates.
Early warning at SKU level. Quote-to-Invoice Gap quantified. Strategic vs. unintentional margin erosion — separated.
Learn more →
Pricing
A model you can trust.
Explainability per cluster. Heterogeneous portfolios. New products without historical data. Out of spreadsheet mode.
Learn more →
Sales
More powerful. Not more controlled.
Deal Calculator. Negotiation arguments, structured. Data that justifies your price — rather than limiting it.
Learn more →
Next step
30 minutes on your pricing reality.
We show you what we typically find in data like yours — and you decide whether the pattern applies to your business too.
EU-hosted · GDPR-compliant · Made in Germany