Margin Sovereignty
Pricing is the strongest lever — and the least used.
One percentage point of additional margin flows directly to EBITDA. In B2B companies with their own product portfolio, percentage points are systematically lost — over years, across thousands of small decisions.
EBITDA margin improvement — range across analyses to date.
Analyses to date · anonymised
of annual revenue sat in the portfolio as untapped margin potential.
Analyses to date · anonymised
to the first measurable lever — from Margin Scan to first implementation.
Analyses to date · anonymised
What finding out costs you
- 2–4 hrs of your time in total
- 1 week to the result
- No interface, no system access
The distinction nobody explains
Descriptive or predictive.
Descriptive — what you have today
Your ERP shows you what was.
Your BI shows you what happened.
Your reporting shows you what changed.
All three systems are retrospective. They diagnose — after the margin is already gone.
Predictive — what Valento adds
Valento shows you where your margin is heading right now.
At SKU level. At customer level. Before you see it in the close.
Early warning instead of post-mortem. Steering instead of diagnosis.
The scale
What pricing really costs — when it doesn't happen.
For a company with €100M revenue and 3 percentage points of margin quietly given away:
€250K
per month
€58K
per week
€8K
per day
What waiting costs
6 months without pricing control at this scale equals roughly €1.5M. Each quarter that passes makes the gap structural — not cyclical.
Indicative, conservatively estimated. The actual margin gap depends on portfolio, customer structure, and pricing discipline — and is calculated precisely in the Margin Scan.
When you do nothing
Standstill is not neutral — it has direction and speed.
What shifts
Margin keeps eroding — typically 1–2 percentage points per year in mature markets without active pricing control. The movement is silent, invisible in the quarterly close.
Who gains margin
Competitors investing in pricing systematically win the highest-margin deals. Those staying reactive increasingly win the weaker ones.
What happens at the board
At the next margin decline, you have two options: explain why it happened — or steer it before it happens.
Three modules
How Margin Sovereignty becomes operational.
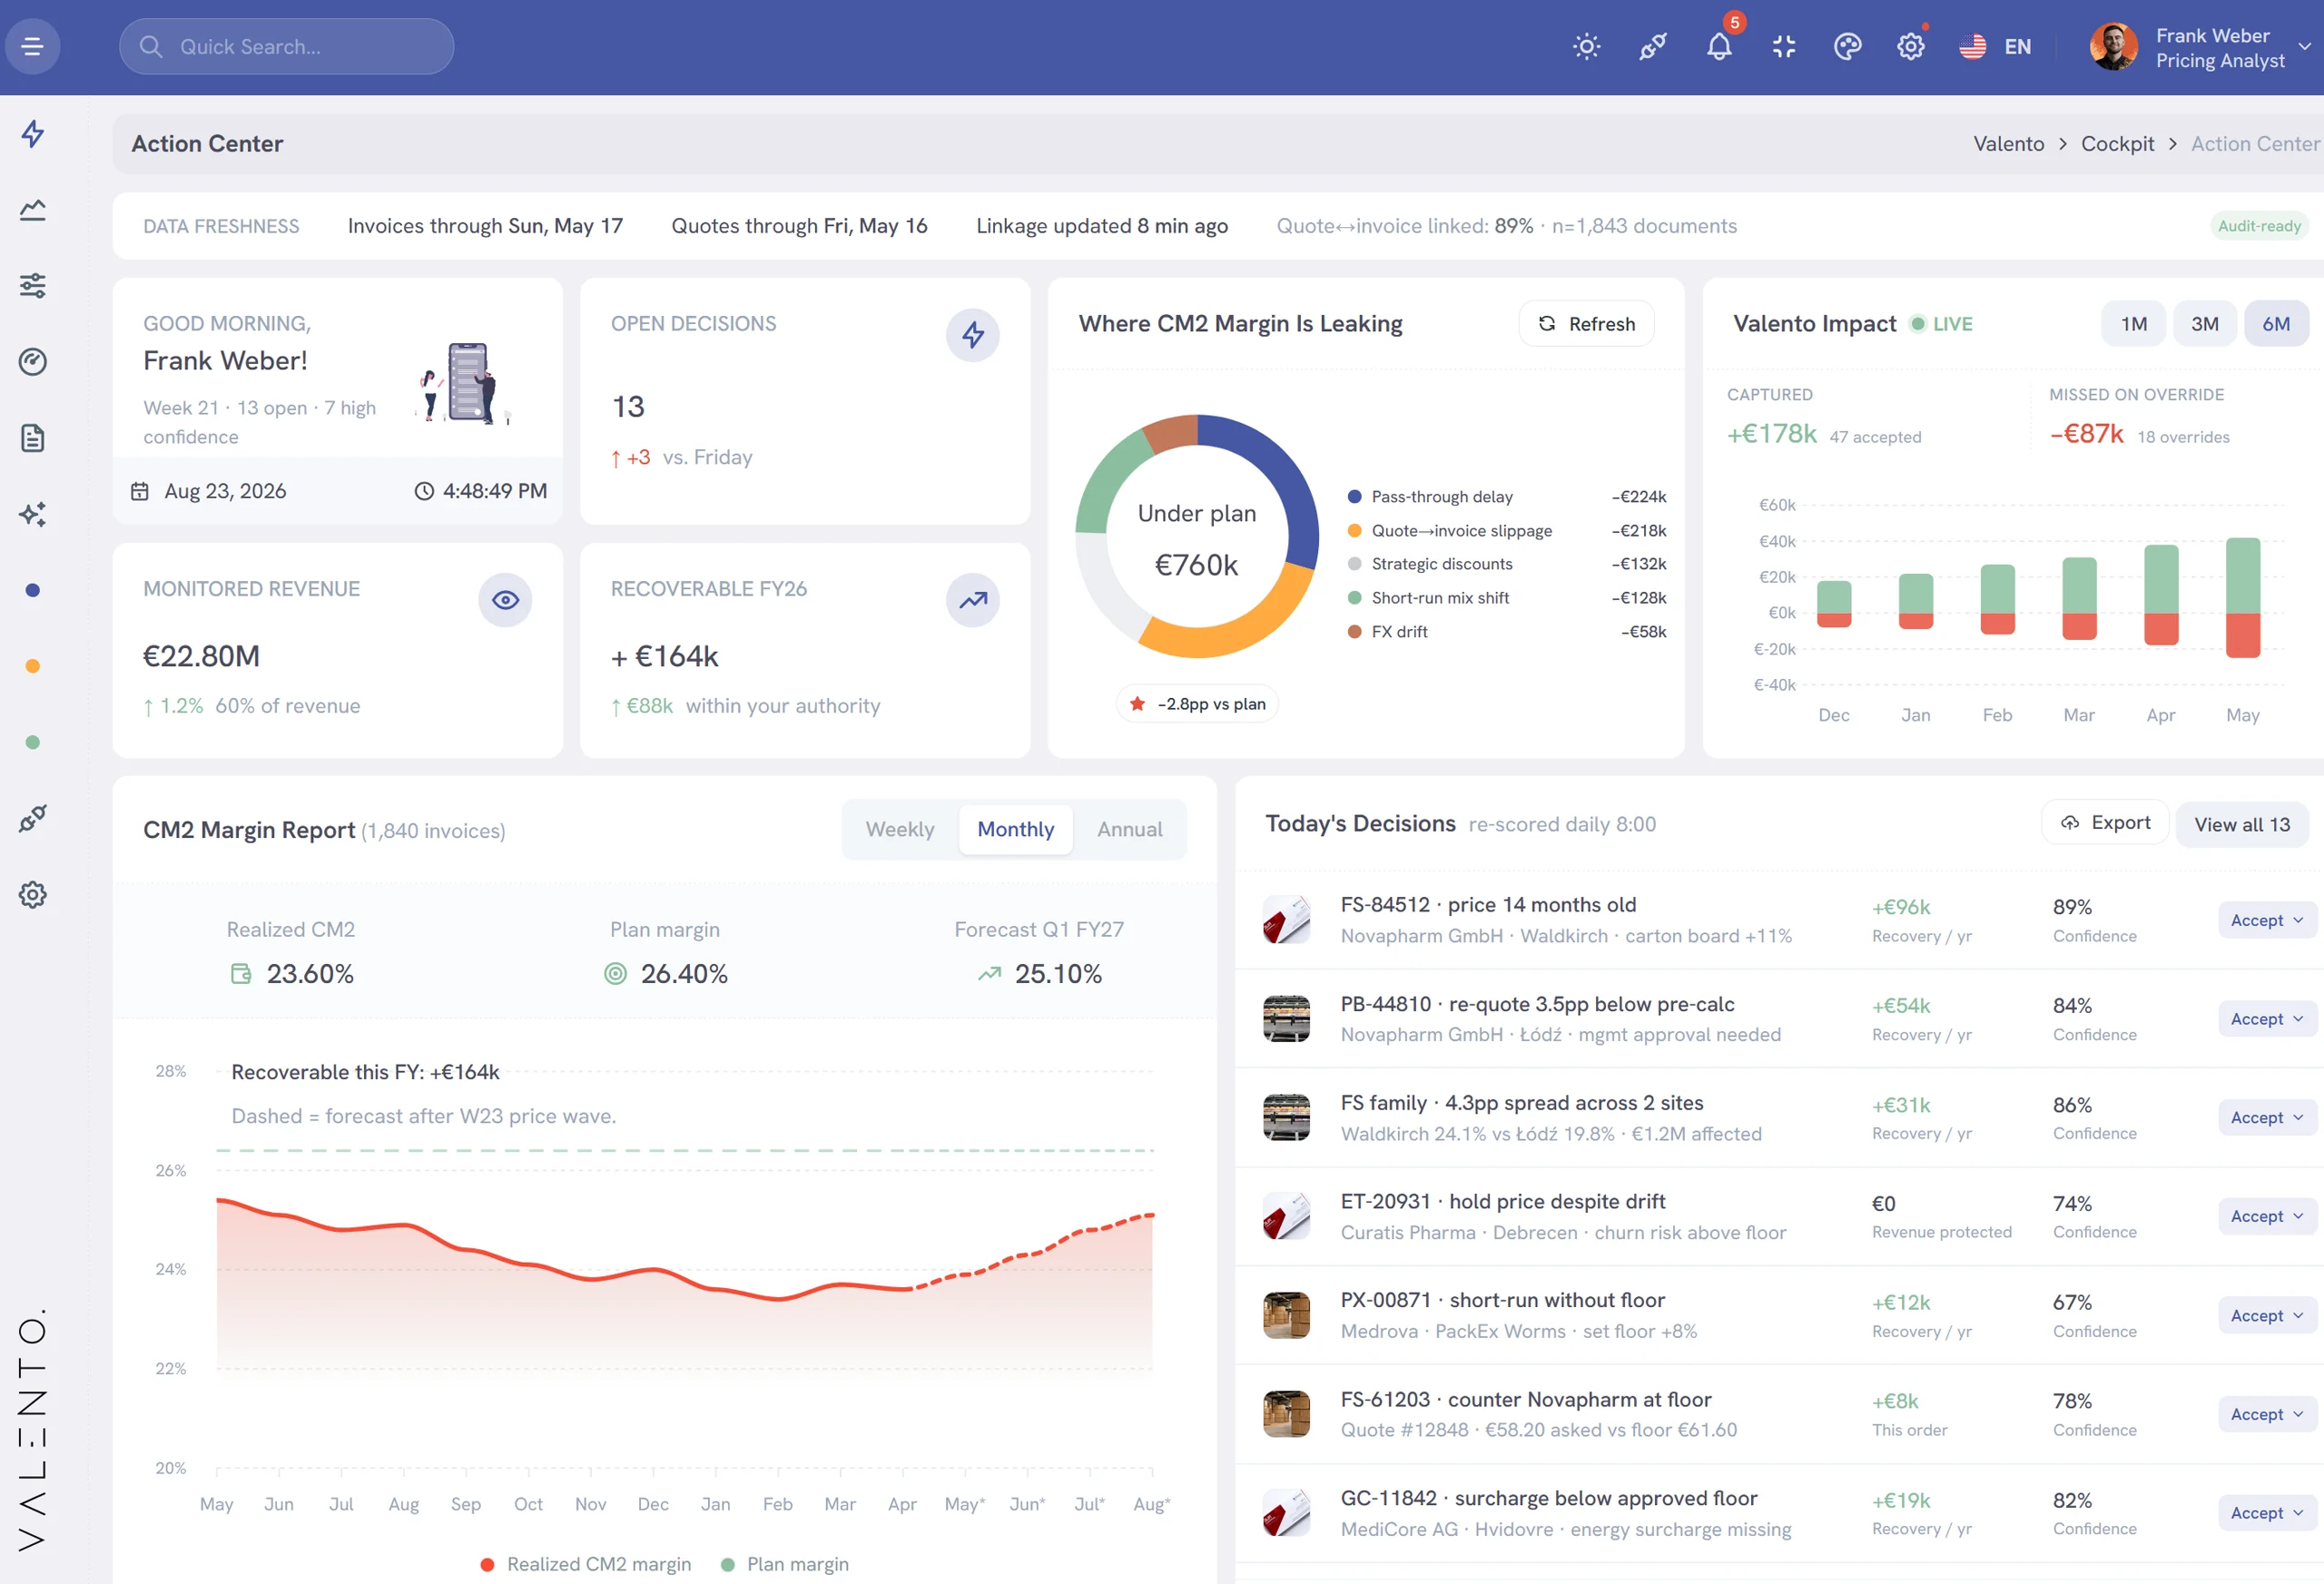
Action Center
Early Warning
You see today which SKUs and customers will become a problem tomorrow — not just at quarter close. Quote-to-Invoice Gap quantified, strategic pricing separated from unintentional erosion.
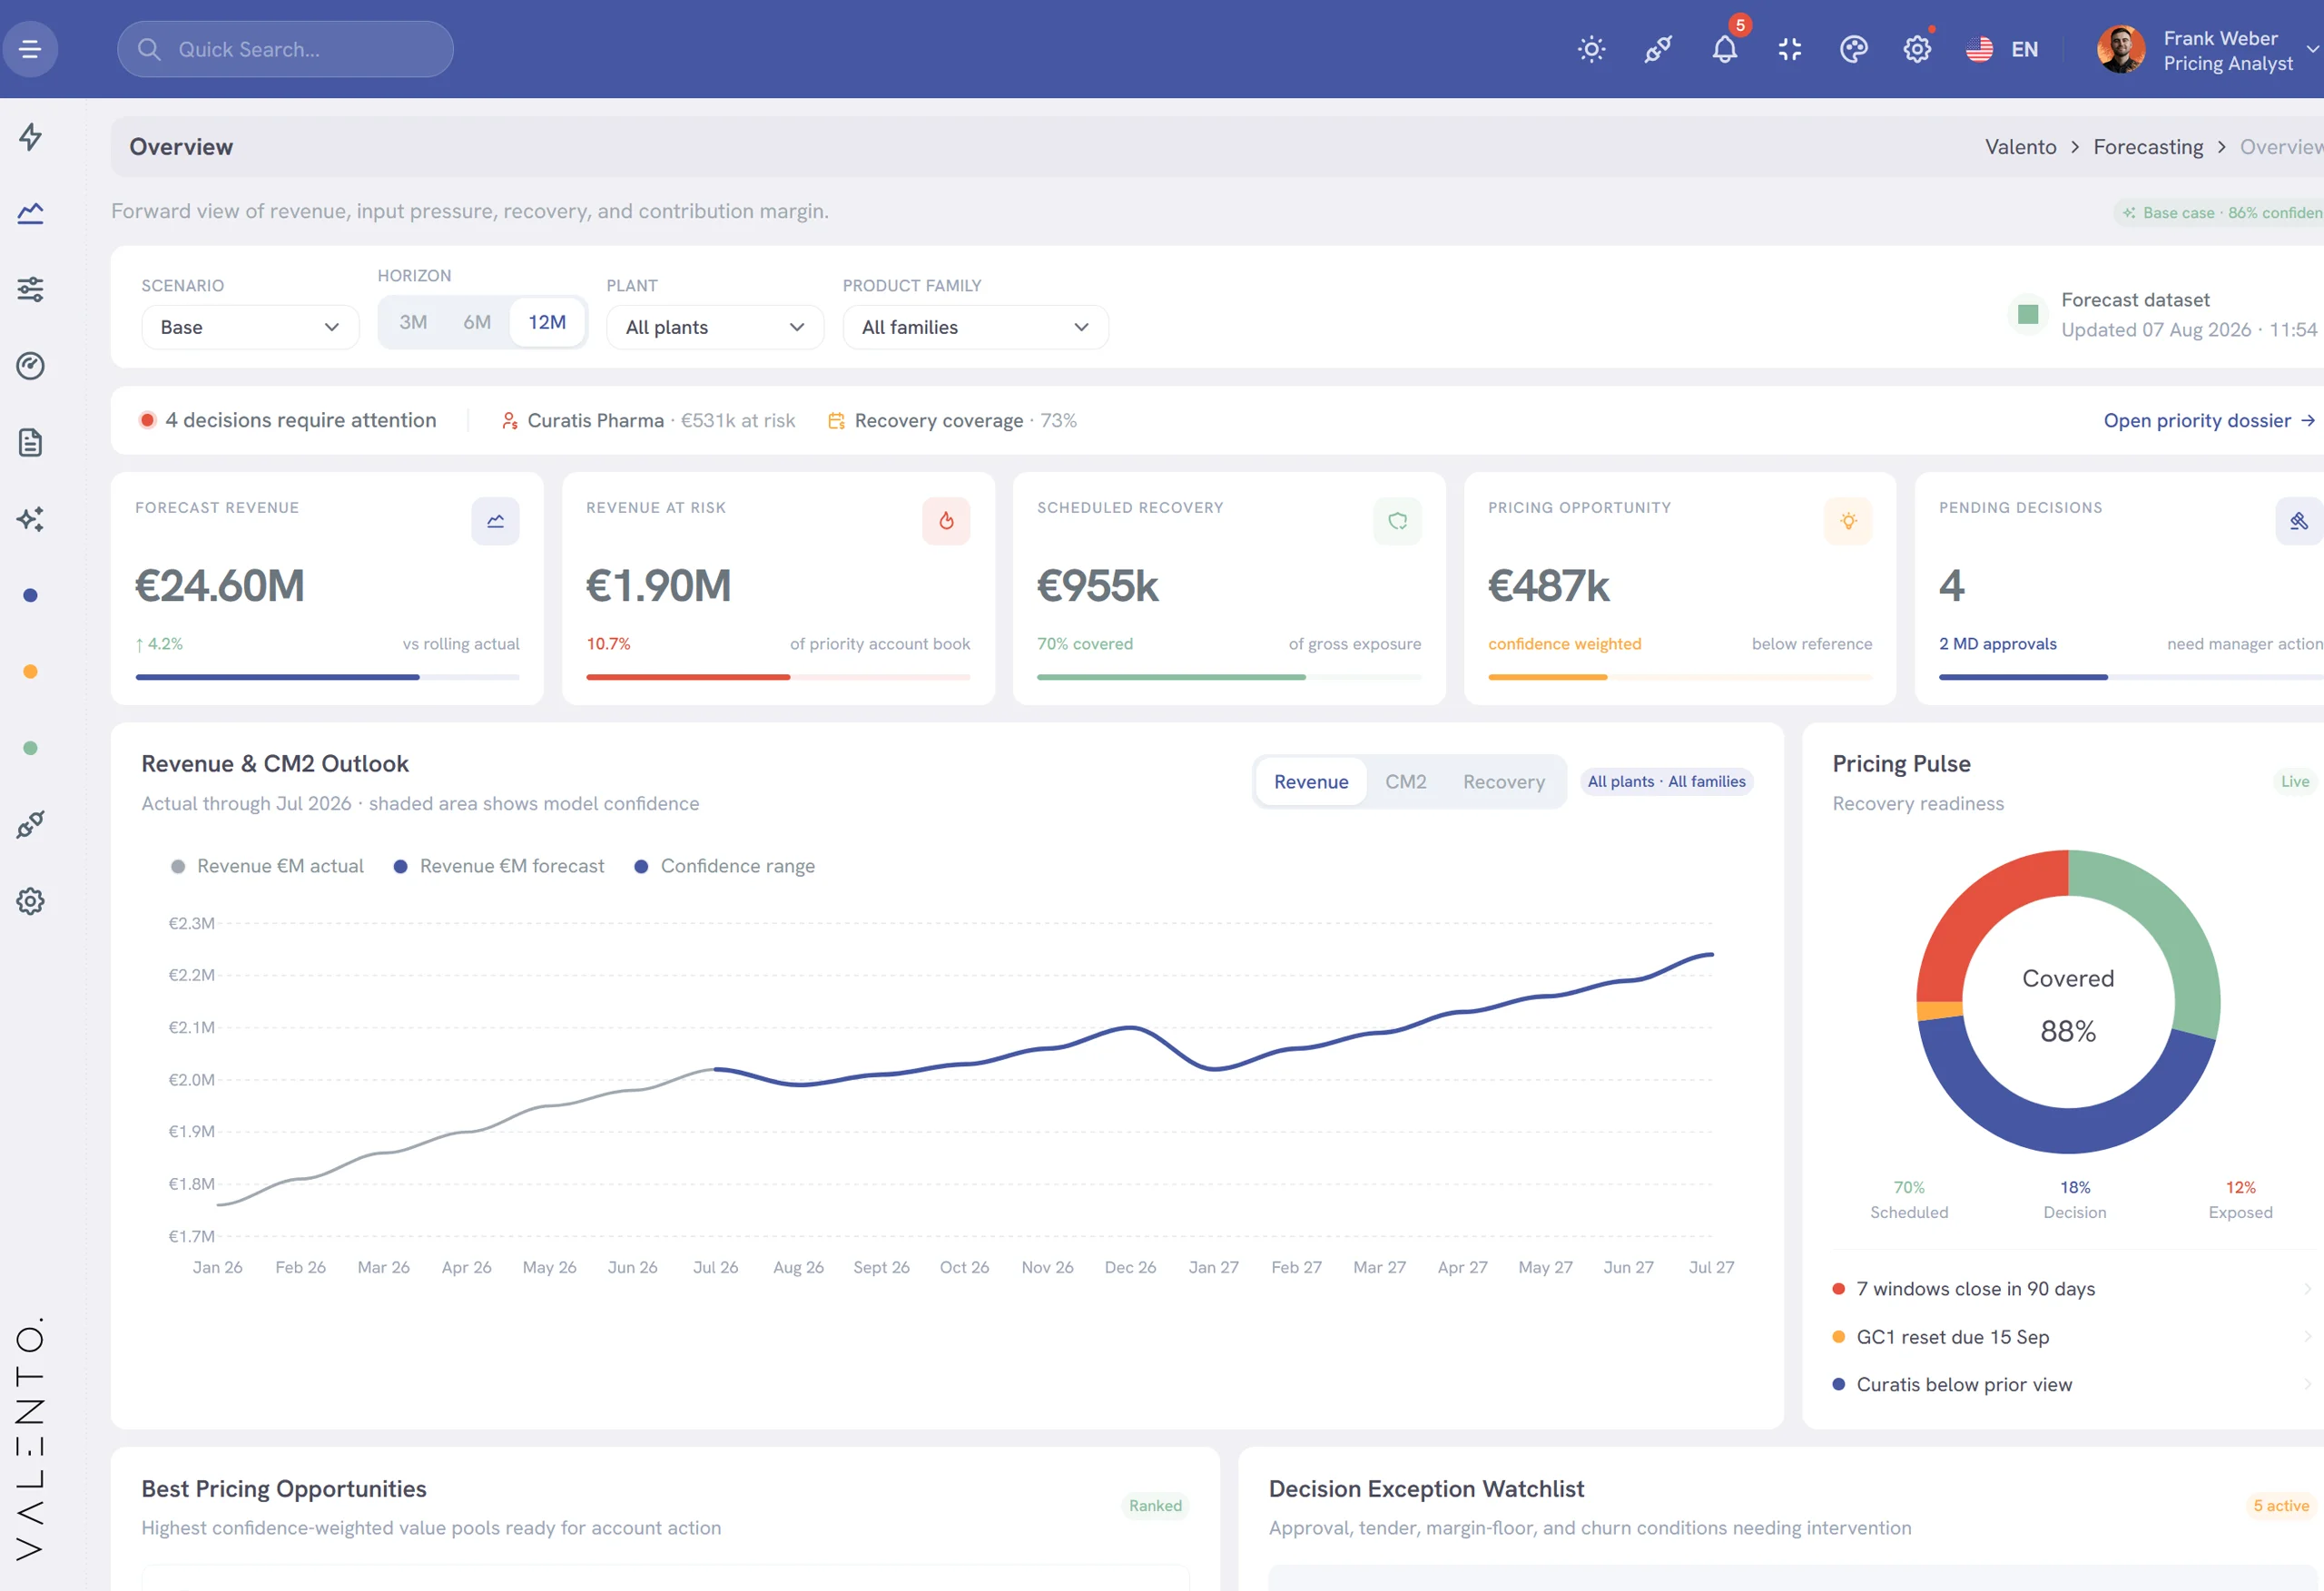
Forecasting
Portfolio Model
You understand every pricing recommendation. Per cluster, per customer, per segment. Explainable — even for heterogeneous portfolios and new products without historical data.
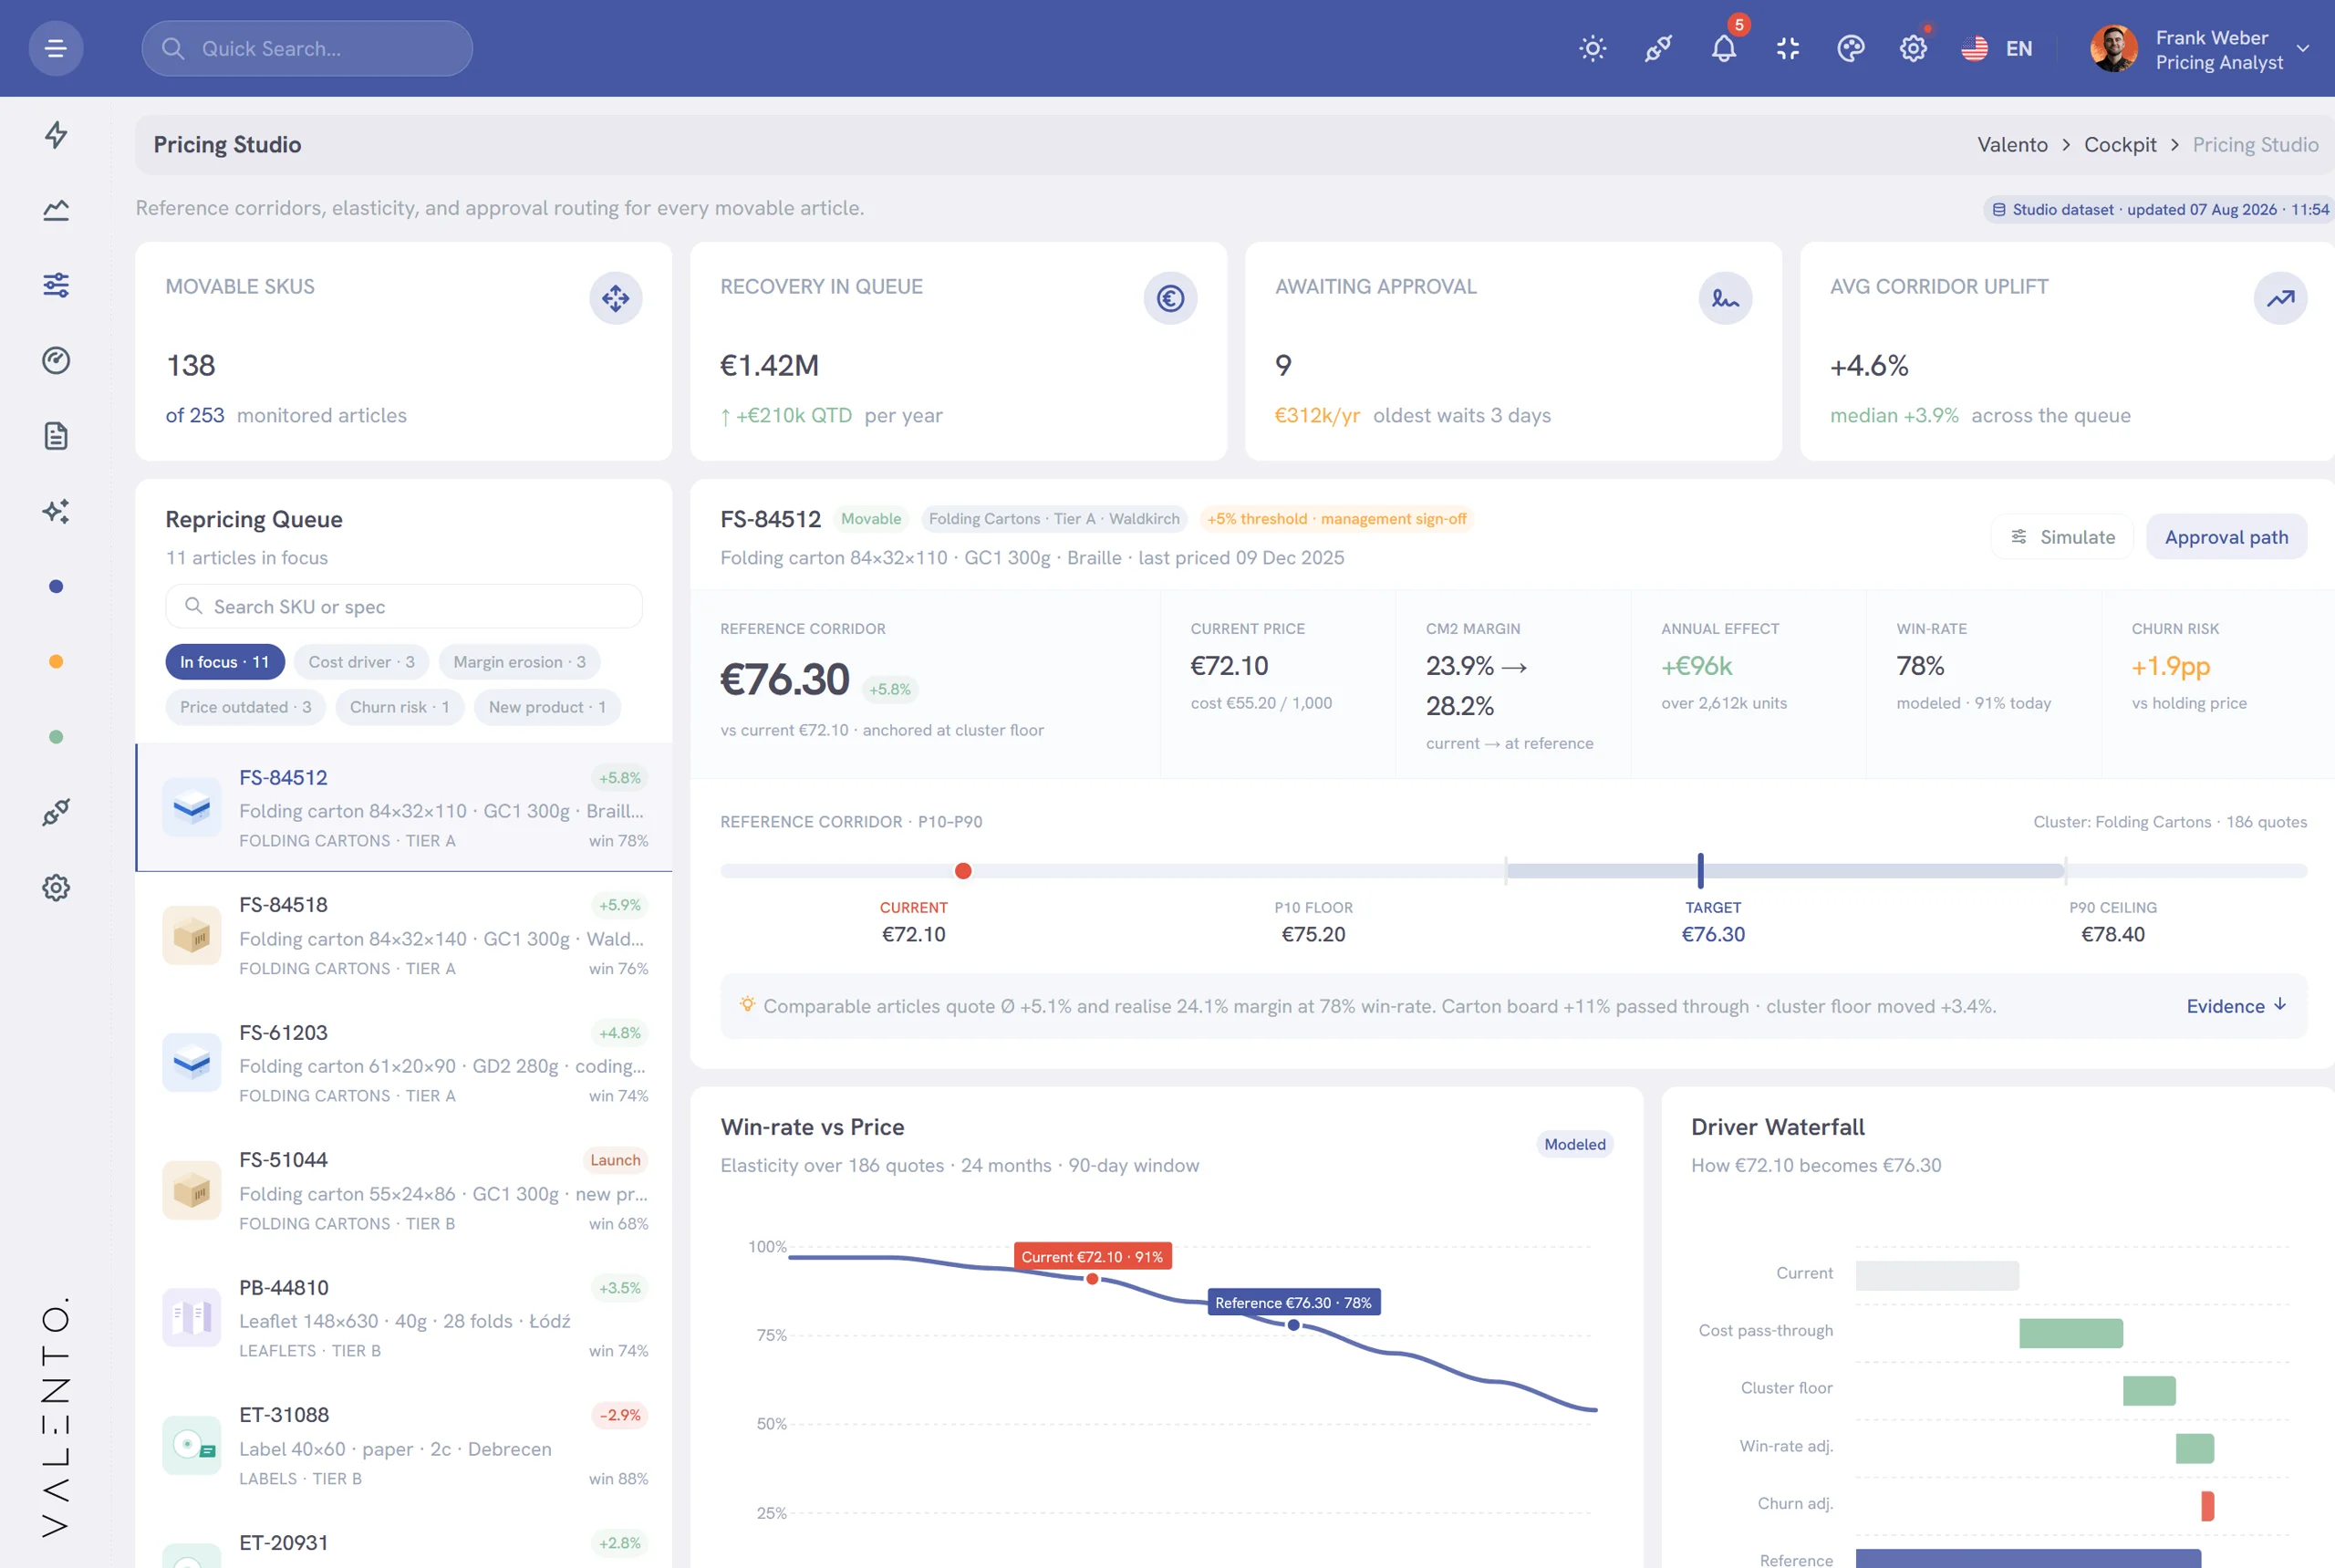
Pricing Studio
Deal Empowerment
Your sales team negotiates with facts, not gut feeling. Structured negotiation arguments, commission impact in view, right where negotiations happen.
Why now
Three shifts that make this topic different today.
Raw material and FX volatility
has been the new normal since 2022. Statically calculated prices erode faster than reporting can make them visible.
Data exists. Discipline doesn't.
ERP migrations and CRM standardisation over recent years have created a data foundation that simply didn't exist before. It is rarely used as a steering basis.
Models without enterprise IT
Predictive ML models for heterogeneous portfolios are production-ready for the first time in 2026 — without enterprise IT, without an 18-month implementation plan.
Next step
30 minutes on your specific situation.
We show you what we typically find in pricing data — and you decide whether a Margin Scan is the right next step.
EU-hosted · GDPR-compliant · Made in Germany